
VOC emission testing pinpoints and measures volatile organic compounds leaking from vehicle tailpipes, factory chimneys and enclosed spaces. At its core, this work transforms invisible threats into concrete data. This process safeguards health and ensures compliance with Australian Design Rules (ADR) and the National Fuel Quality Standards.
Invisible pollutants hide in plain sight until we collect samples and send them for analysis. Modern labs can identify traces of benzene, toluene and dozens more chemicals down to parts per billion. A simple grab sample can unmask complex pollution puzzles.
Why VOC Emission Testing Matters
VOC emissions leave a subtle fingerprint on our air. For example, benzene from vehicle exhaust can settle in your lungs and trigger irritation or longer-term issues. Meanwhile, industrial stacks may discharge a cocktail of hydrocarbons that standard checks might miss.
- Protect Health through early detection of irritants
- Ensure Regulatory Compliance with ADR and fuel quality mandates
- Enhance Environmental Quality by monitoring real-world emissions
By turning uncertain exposures into actionable figures, testing lets engineers and facility managers prioritise safety upgrades and process tweaks.
Introduction To Emission Standards
In Australia, emission rules kicked off back in the 1970s with ADR26, limiting pollutants at idle. Today’s ADR protocols cover multiple drive cycles and strict timing windows to reflect real-world conditions. Meanwhile, indoor air specialists follow similar principles, tuning procedures for homes, offices and factories.
If you need a deep dive on indoor conditions, check out our comprehensive guide on indoor air quality VOC testing.
Sampling might use sealed canisters, sorbent tubes or continuous monitors that log fluctuations over hours. The key is choosing the right method for your target compounds and environment.
Key Insight Accurate sampling and analysis underpin the credibility of emission results.
From here, we’ll break down each method, share practical examples and outline quality checks that keep results rock solid.
Key Benefits
- Early Warning flags hidden leaks before they escalate into costly shutdowns or health hazards
- Regulatory Alignment ensures you meet ADR standards and local environmental requirements
- Data for Action drives smarter choices on ventilation upgrades, fuel formulations and process controls
Clear numbers drive better decisions.
Real-World Analogy
Think of VOC testing like forensic fingerprinting at a scene. Each chemical leaves its own signature—be it paint, fuel vapour or cleaning solvent. By matching these profiles, you can trace back to the source and shut down the leak.
Scope Of Testing
VOC emission testing spans a diverse array of contexts. Vehicle studies sample tailpipe discharges under controlled drive cycles. Industrial stack sampling pulls gases with isokinetic probes at various heights and flow rates. Indoor assessments use chambers or direct-read monitors to map air quality across rooms.
- Vehicle Tailpipe Sampling
- Stack Emission Analysis
- Indoor Air Chamber Tests
- Sorbent Tube Sampling
Each scenario demands its own sampling duration, calibration schedule and analysis protocol to ensure the figures you gather truly reflect reality.
Understanding How VOC Emission Testing Works
Imagine a VOC emission test as a trusted family recipe. Each step is measured, timed and repeated to tease out hidden chemical “flavours” from a vehicle’s exhaust or fuel system.
To start, technicians focus on three core methods:
- Exhaust Sampling uses a probe to capture tailpipe gases during predefined drive cycles.
- Evaporative Testing seals the fuel system or chamber and tracks vapour loss under controlled pressure.
- OBD Monitoring reads on-board diagnostics in real time, flagging emission spikes instantly.
Behind the scenes, gas chromatography works like a high-precision scanner, separating every compound in a vapour sample. Meanwhile, mass spectrometry fingerprints each molecule by matching ionised fragments to known VOC profiles. And OBD systems act like a kitchen timer—always watching, always ready to alert.
Test Cycle Simulations
In the lab, simulated drive cycles mimic real-world speed, load and temperature changes. By doing so, they reveal how a vehicle really behaves, not just how it performs in ideal conditions.
Key metrics include total hydrocarbon concentration and CO₂ proxies, all measured under Australian Design Rules (ADR) protocols. This approach highlights gaps between laboratory results and on-road performance, especially as vehicles age or encounter variable maintenance histories.
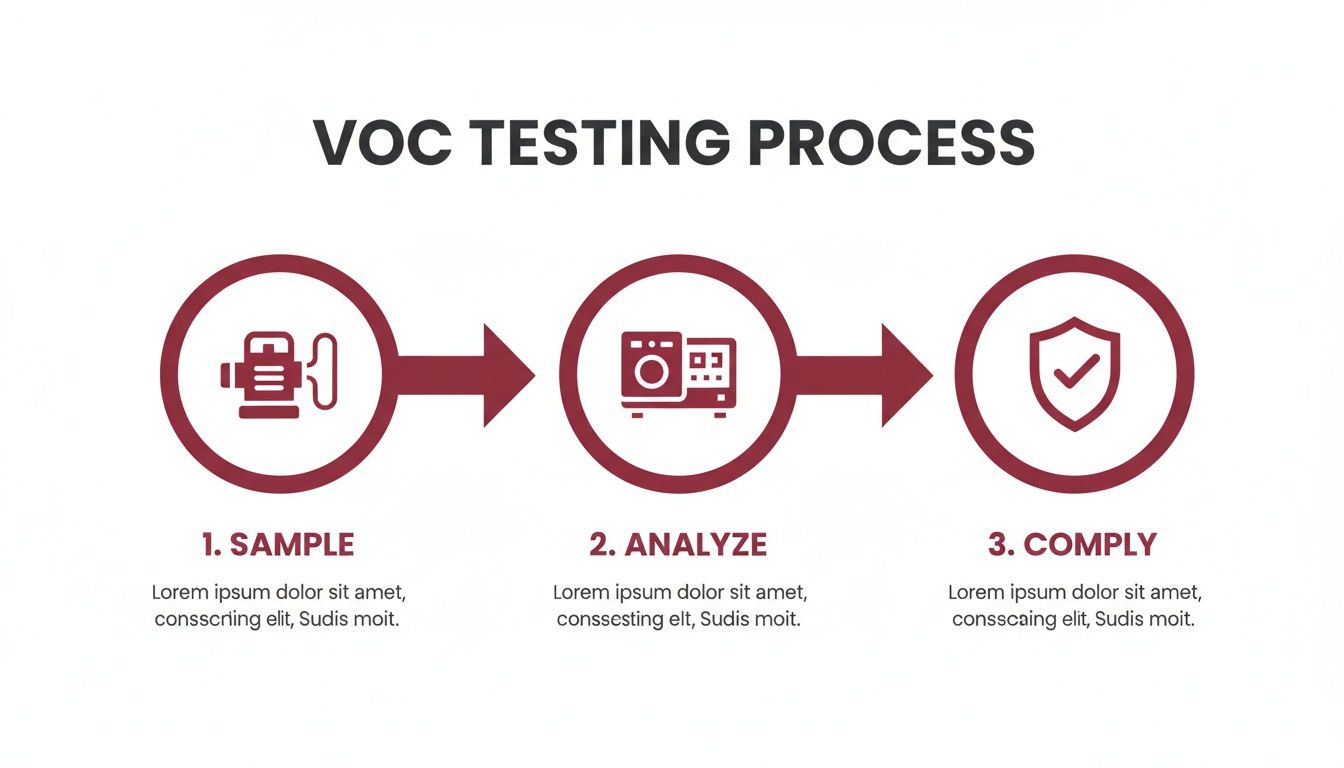
Below is an infographic visualising the core steps in VOC emission testing processes.
In January 2024, Australia’s fleet-wide emissions intensity averaged 193.7 g/km, compared with 165.2 g/km for new-vehicle sales in 2023. Insights like these come from detailed reporting such as the National Transport Commission report.
Comparison Of Emission Test Protocols
When you pit one test cycle against another, the difference in real-world deviation becomes clear. Here’s a quick look:
Comparison of Emission Test Protocols
| Test Protocol | Introduced | Cycle Duration | Real-World Deviation | Region |
|---|---|---|---|---|
| NEDC | 1992 | 20 min | Up to 30% higher | EU/legacy AU |
| WLTP | 2017 | 30 min | ~10% higher | Global |
| ADR 79/01 | 2000 | 20 min | ~20% higher | Australia |
| RDE | 2016 | Dynamic | Variable | EU/AU |
Even a glance at this table shows how WLTP narrows the gap between lab figures and what drivers see on the road.
Key Insight WLTP usage reduces real-world deviation to near practical levels compared with legacy standards.
For a deeper dive, check out our guide on VOC testing methods.
Ensuring Quality Assurance
Every batch of tests kicks off with calibration checks to ensure instruments sit exactly within tolerance. Technicians then run blank samples and control checks to rule out any contamination. Regular maintenance of pumps and detectors keeps data accurate day after day.
Practical Equipment Setup
Placement matters. Sampling pumps are positioned to avoid cross-contamination, while sorbent tubes are carefully conditioned and weighed before and after sampling to confirm uptake efficiency. Technicians also note humidity and temperature, since both can skew adsorption rates.
Interpreting Results
Raw numbers gain meaning when compared against ADR limits or ambient air guidelines. For instance, a total hydrocarbon reading over 10 ppm could point to a developing fuel-system leak or overdue maintenance. And CO₂ proxy data helps estimate combustion efficiency, guiding targeted emission-reduction strategies.
Key Takeaways
- Treat testing workflows like recipes—sampling, analysis and quality checks must all blend perfectly.
- Use gas chromatography, mass spectrometry and OBD in concert to capture every VOC signature.
- Rely on calibration, blank runs and controls to keep your data bullet-proof.
Real-World Applications
- Fleet managers run dynamic cycles to spot elevated VOCs under varied loads and speeds.
- Indoor-air professionals use portable monitors to map office spaces and safeguard occupants.
- Manufacturers deploy snapshot and continuous sampling to identify solvent leaks and optimise emission controls.
Evolution Of Australian Emission Standards
Over the past five decades, the Australian Design Rules (ADRs) have shaped how we measure VOC emissions—much like a sound engineer tuning an orchestra as each musician hits the right note.
What began as simple idle CO checks now spans full drive cycle assessments on sophisticated rolling roads.
- ADR26/1972 introduced idle CO limits for petrol vehicles
- ADR27/1974 set mass-based controls for HC, CO and NOx
- ADR79/01 aligned with Euro 3, cutting HC by an order of magnitude
- National Fuel Quality Standards added VOC content caps for fuels
- Adoption of WLTP benchmarks modernised testing with real-world scenarios
Early Regulations And Idle Checks
When ADR26/1972 landed, technicians treated emissions like a simple smoke test: vehicles idling on tick-over while analysts sampled CO.
Idle tests were easy to run, but they missed spikes when the throttle opened or the engine laboured uphill.
That gap prompted calls for more dynamic sampling—paving the way toward drive cycles that mimic everyday journeys.
Shift To Mass-Based Controls
By ADR27/1974, regulators had moved to mass-based limits, measuring pollutants in grams per kilometre instead of mere concentration.
This change forced cars to behave more like precision instruments than informal chimneys, reflecting true on-road performance.
It also spurred engine builders and suppliers to innovate:
- HC limits drove combustion-chamber redesigns
- CO thresholds accelerated catalytic-converter adoption
- NOx caps introduced lean-burn systems and exhaust gas recirculation
Euro Equivalent Standards
Global alignment took centre stage with ADR79/01, the Euro 3 counterpart that slashed hydrocarbon emissions from 1990 levels by an order of magnitude.
Over 40 years, ADR updates have steadily tightened the reins, turning lab-only checks into real-world trials. Read the full research on historical emission trends
“Emissions dropped dramatically as ADR updates forced real-world testing over lab-only checks.”
Around the same time, voluntary CO₂ targets nudged manufacturers to think about greenhouse gases alongside VOCs.
Modern Drive Cycles And WLTP
Fuel quality rules under the National Fuel Quality Standards tightened benzene and other VOC precursors even before combustion.
Then WLTP arrived, simulating urban starts, highway runs and temperature swings in the lab.
Engineers now:
- Define real-world driving patterns
- Simulate those cycles under controlled conditions
- Measure VOCs plus CO, NOx and particulate matter
- Compare results to WLTP benchmarks
These steps blend decades of insights into a single, robust testing framework.
Current Best Practices
Today’s labs use dynamic test cells with tight environmental control to reproduce on-road conditions consistently.
Advanced sensors and correction algorithms account for temperature and humidity shifts in real time.
- Use dynamic test cells with environmental control for repeatable results
- Integrate advanced sensors for real-time correction factors
- Regularly update test protocols to reflect new ADR amendments
- Engage cross-functional teams for compliance and data interpretation
By following these practices, teams ensure quality stays high as regulations evolve.
This historical tour lays the groundwork for our next deep-dive into effective VOC testing components. Stay tuned for practical guidance and case studies.
Key Components Of Effective Voc Testing
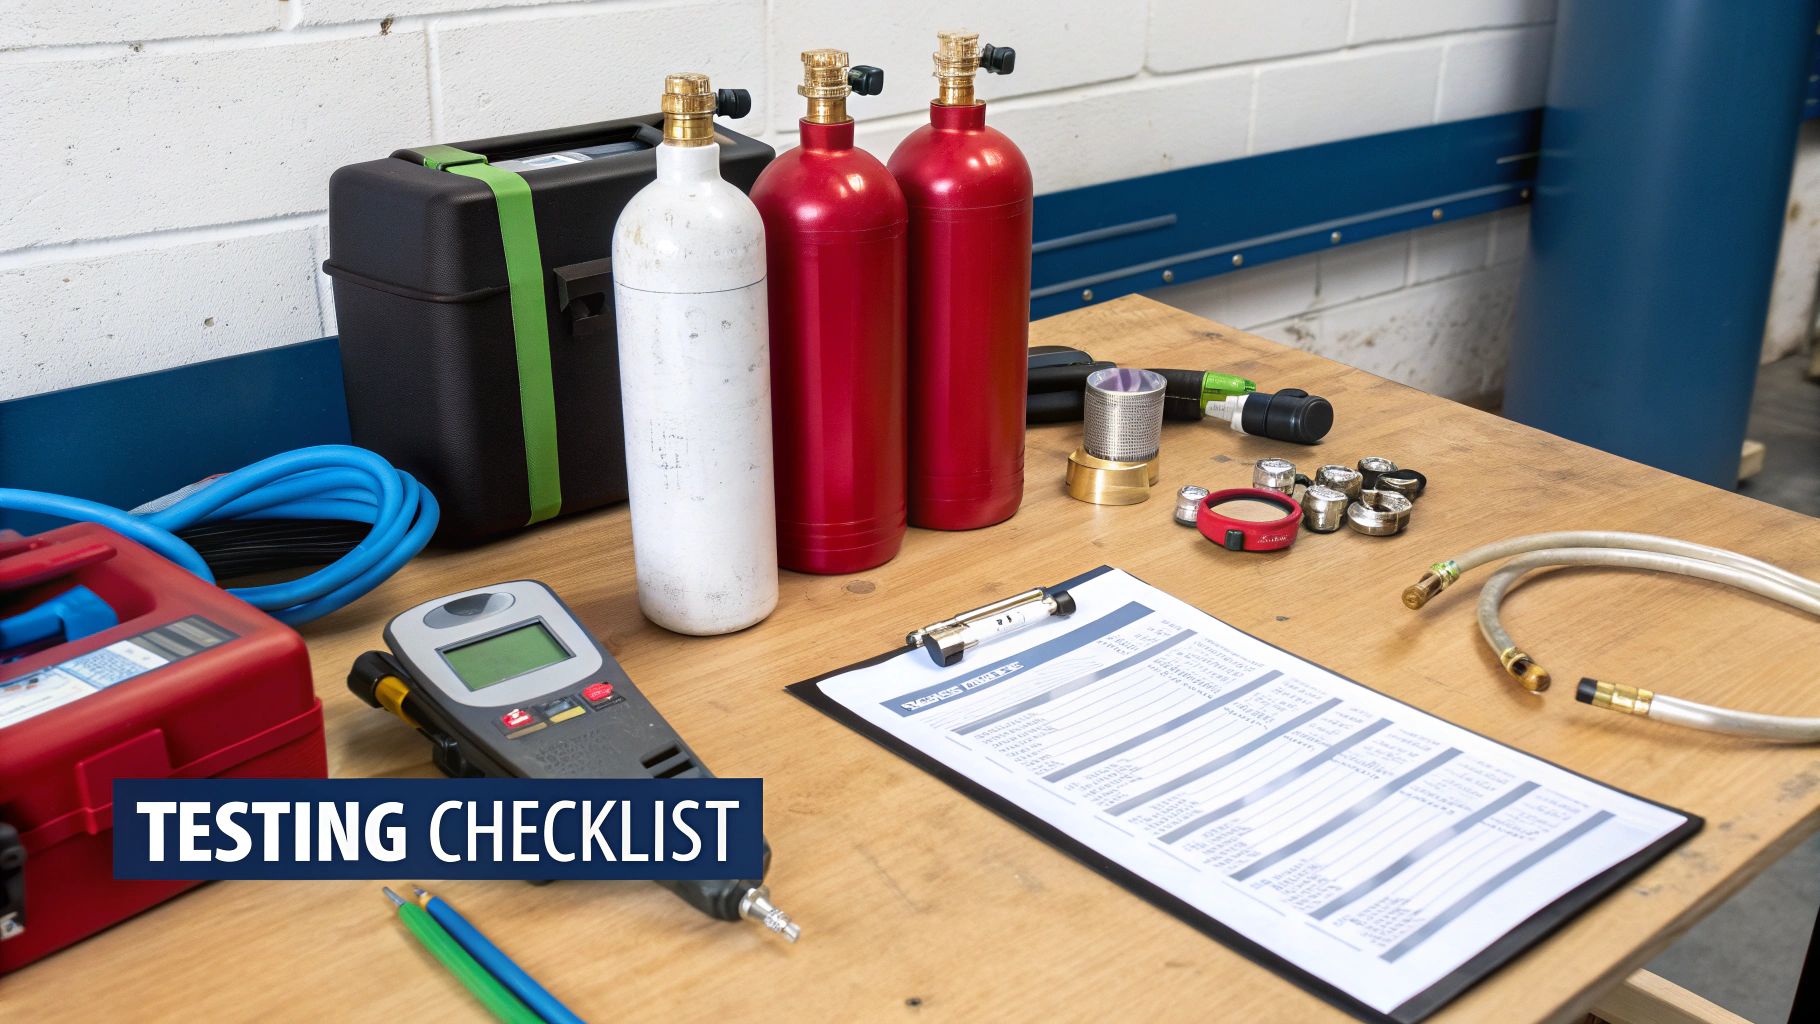
Think of a VOC emission testing programme much like erecting a high-rise. Every part must fit perfectly to guarantee stability, accuracy and reliability.
At the heart of this structure are five critical elements:
- Site Selection
- Equipment Preparation
- Instrument Calibration
- Sampling Methods
- Quality Control
Each one is as vital as the steel beams or concrete foundations in a building.
Vehicle Preparation And Equipment Setup
Getting the vehicle ready is like levelling the ground before you pour concrete. Inspect hoses, probes and seals to catch leaks that could skew your results.
- Check seals to prevent sample loss
- Measure flow rates against ADR protocols
- Log each piece of kit’s condition for future reference
Position the vehicle on a calibrated platform and keep fuel temperatures steady to eliminate cross-contamination risks.
Instrument Calibration Best Practices
Calibration is your surveying stage—align your instruments before you start laying down data. Flow meters and gas chromatographs need regular zero and span checks.
Daily calibration checks should be noted in your logbook to track any performance drift.
“Consistent calibration ensures data integrity and compliance with ADR requirements” – Senior Test Engineer
Always use fresh, certified gases (no older than three months) and run drift checks frequently. This way, tiny sensor shifts won’t undermine your entire dataset.
Sampling Methods And Accuracy Trade-Offs
Different projects call for different approaches—much like choosing bricks versus steel. Here are three popular options:
- Grab Sampling captures an instant snapshot—ideal for spot checks.
- Continuous Monitoring records shifts over time—perfect for trend analysis.
- Sorbent Tube Sampling concentrates VOCs for detailed lab work.
In one solvent-leak case study, sorbent tubes uncovered a 25% underreporting in emissions. Picking the right method hinges on understanding these trade-offs.
Quality Control And Data Assurance
Quality control holds everything together, just as inspections keep a construction site on track. From the moment a sample is taken to the final report, each step must be airtight.
| Step | Purpose | Responsible Party |
|---|---|---|
| Sample Labelling | Prevent mix-ups in the lab | Field Technician |
| Chain-of-Custody | Track sample control from collection | Quality Assurance Officer |
| Data Validation | Verify analytical results accuracy | Lab Analyst |
Data checkpoints flag anomalies early, avoiding costly repeat tests. And remember: temperature swings of 10°C can alter adsorption rates by up to 15%, so log ambient conditions.
Finally, keep a checklist to tie all elements together:
- Site coordinates and environmental logs
- Equipment maintenance and calibration records
- Selected sampling method matched to VOC species
- Chain-of-custody documentation
- Data validation and final reporting templates
This blueprint will guide you towards a compliant, trustworthy VOC emission testing programme.
Ongoing Improvement And Review
Just as buildings need maintenance, your testing framework demands periodic updates. Regulations change, new VOCs emerge, and instruments evolve.
- Schedule annual protocol audits to find any gaps
- Refresh training materials as new tools arrive
- Revisit sampling strategies when fresh VOC priorities appear
This proactive stance cements your data’s credibility and keeps your programme ahead of regulatory updates.
Industry Applications Of Voc Emission Testing
Across Australia, VOC emission testing underpins everything from highway traffic monitoring to urban paint booths. It’s where data meets regulation and public health.
Relying on the old New European Drive Cycle, on-road emissions were found to be 45% higher than lab figures by 2021. For a closer look, see Australian passenger vehicle emissions on UTS News.
Automotive Testing
When it comes to vehicles, two checks dominate: exhaust and evaporative emissions. Both are governed by Australia’s ADR protocols.
A heated probe ushers exhaust gases through FTIR or FID detectors, tracking compounds like benzene and toluene. Meanwhile, evaporative tests seal the fuel system, watching for vapour leaks under set temperatures.
- Exhaust Sampling: Heated sampling lines capture hydrocarbons along standard drive cycles.
- Evaporative Testing: Canisters and sorbent tubes record vapour losses.
- Test Frequency: Conducted at type-approval and periodic in-service inspections.

This diagram highlights the sampling points and instruments that ensure tailpipe readings are spot on.
Manufacturing And Construction
In a printing plant, pinpointing solvent hotspots with targeted VOC tests led to revamped ventilation—and a 30% emission cut in weeks. On construction sites, paint booths rely on continuous samplers to lock in safety thresholds.
- Continuous Monitors: Flag spikes above 5 ppm in real time.
- Scheduled Canister Runs: Measure longer-term exposures in spray areas.
For a deep dive on product-level assessments, visit our guide on VOC product emission testing.
Indoor And Ambient Monitoring
Commercial buildings use handheld sensors to map VOC “hot zones” room by room. That data drives HVAC tweaks and air-purifier placement. Outside, researchers track ozone precursors—like isoprene and terpenes—across seasons to feed air-quality models.
- Mobile Vans: Survey urban fringes for concentration gradients.
- Fixed Stations: Use GC chromatographs for daily species breakdown.
- UV Photolysis Instruments: Log ozone precursors hourly.
Balancing on-the-fly sensors with lab-grade analysis delivers both fast alerts and detailed speciation.
Industry Applications of VOC Emission Testing
Below is a snapshot of how key sectors deploy VOC testing to meet their goals:
| Industry | Application | Key VOCs | Primary Benefit |
|---|---|---|---|
| Automotive | Exhaust & Evaporative Testing | Benzene, Toluene | Compliance with ADR Limits |
| Manufacturing | Solvent Emission Surveillance | Xylene, Hexane | Process Optimisation & Leak Control |
| Construction | Paint Booth Continuous Sampling | Styrene, Ethylbenzene | Worker Safety & Regulatory Adherence |
| Commercial Buildings | Indoor Air Quality Mapping | Formaldehyde, TVOCs | Health Risk Reduction |
| Environmental Research | Ozone Precursor Analysis | Isoprene, Terpenes | Air Quality Modelling |
Whether it’s a shop floor or a city street, these real-world examples show how tailored VOC testing keeps operations safe, compliant and efficient.
Key Takeaway
Accurate VOC emission testing drives practical steps—from process tweaks to policy decisions—that protect health and satisfy regulators.
Start by choosing a provider with NATA accreditation and cross-industry know-how. Look for reports that include compound-by-compound tables, time-series trends and concise, actionable summaries. That way, your next move—be it mitigation or monitoring—rests on solid evidence.
Benefits And Future Trends Of VOC Emission Testing
VOC emission testing isn’t just a compliance checkbox—it’s the foundation for smarter environmental decisions. Lab-based analysis often outperforms handheld detectors in both sensitivity and repeatability. With accredited facilities following traceable QA protocols, you get consistent, reliable results every time.
- Early Leak Detection can reduce remediation costs by up to 30%.
- Verified Data boosts corporate sustainability and regulatory reporting.
- Reputation Lift flows from transparent emission performance.
Cost–benefit studies frequently show solid returns within a year, simply by catching minor issues before they escalate.
Tangible Benefits For Organisations
When you feed test data into maintenance schedules, unplanned downtime drops and operational risks shrink. For instance, a refinery identified purge-cycle tweaks that cut VOC leaks by 40%.
Key Detail
Verified lab data offsets sensor drift and false alarms.
NATA-accredited reports also build stakeholder confidence:
- Reduced compliance costs through fewer regulatory penalties
- Better health outcomes for workers in high-exposure zones
- Streamlined reporting with compound-specific breakdowns
These wins reinforce broader sustainability targets and keep teams focused on continuous improvement.
Emerging Technologies In VOC Emission Testing
Advances in remote monitoring and analytics are shifting testing from occasional snapshots to near-real-time insights. Today’s handheld sensors detect VOCs down to 1 ppb, while IoT-enabled nodes sample air across wide areas and feed centralised dashboards.
- Low-cost sampling nodes for wide-area coverage
- IoT links data streams to a central hub
- AI-driven analytics flag anomalies and trigger alerts
| Technology | Advantage | Impact |
|---|---|---|
| Lab Instruments | High sensitivity (< 1 ppb) | Accurate baseline data |
| Handheld Sensors | Portability and frequent checks | Responsive leak detection |
| Remote Networks | Continuous area coverage | Granular, live emission mapping |
| AI Analytics | Predictive anomaly spotting | Proactive maintenance planning |
As regulations tighten, we’ll see faster uptake of these tools—and AI models that forecast emission spikes before they happen.
Planning For Future Compliance
A flexible strategy today means smoother compliance tomorrow. Blend periodic lab tests with remote sensors, then:
- Establish a baseline emission profile with lab analyses
- Integrate portable sensors for daily spot-checks
- Set up remote dashboards for live monitoring
- Review analytics quarterly and refine your approach
Early adopters often see ROI exceed 150%, thanks to fewer fines and less downtime.
“Proactive VOC emission testing pays dividends through prevention.”
Anitech Ltd Pty offers expert guidance to build robust testing programmes nationwide. Our multidisciplinary team supports everything from sampling to reporting, using techniques such as GC-MS, GC-FID and FTIR for comprehensive coverage:
- GC-MS for detailed molecular identification
- GC-FID for rapid hydrocarbon quantification
- FTIR for multi-component analysis in a single run
Transparent reports include time-series charts and summary tables, so operations teams can act on real data—fast. With upcoming ADR updates likely to mandate continuous testing, now is the time to future-proof your emission programme.
Next Steps For Emission Programmes
Kick off by auditing your current VOC testing workflows and pinpointing gaps in sampling frequency and calibration. Then:
- Define emission reduction targets that align with sustainability goals
- Schedule a mix of lab and field-based testing methods
- Allocate budget for sensor upkeep and software licences
- Train personnel on new tools and data interpretation
Regular reviews and adjustments will keep your programme ahead of regulatory shifts. By embracing continuous monitoring and emerging technologies, organisations not only meet ADR requirements but also unlock real value.
Future Outlook
A blend of portable sensors, remote networks and AI analytics will define next-generation testing.
Early adopters will enjoy quicker issue resolution and stronger compliance records. Partner with Anitech Ltd Pty for tailored support.
Visit occhygiene.com.au to learn more.
FAQ
Testing VOC emissions pulls in multiple variables—and that naturally sparks plenty of questions for operators and regulators. This FAQ cuts through the jargon to give you straightforward answers.
What you’ll find here:
- The difference between exhaust and evaporative VOC emission testing
- How often vehicles and facilities need checking under ADR standards
- The most common sources of measurement error
- Steps organisations can take to prepare for a compliance audit
Common Questions Answered
1. What Is The Difference Between Exhaust And Evaporative VOC Emission Testing?
Exhaust testing measures what comes out of the tailpipe as the engine runs through its cycles. Evaporative testing, on the other hand, seals the fuel system inside a chamber to catch any vapour losses.
2. How Often Should Vehicles And Facilities Be Tested Under ADR Standards?
Type-approved vehicles get in-service checks every five years. Facilities typically face quarterly or annual inspections, depending on the specific ADR requirements.
3. What Are Common Sources Of Measurement Error In VOC Emission Testing?
You’ll most often see errors from:
- Calibration drift in analysers
- Sample contamination
- Environmental shifts like temperature or humidity changes
Routine instrument checks and strict quality-control procedures are your best defences.
4. How Can Organisations Prepare For An Official Compliance Audit?
A thorough audit plan covers:
- Up-to-date chain-of-custody records
- Detailed calibration logs
- Clear standard operating procedures
- Mock audits to identify gaps before regulators arrive
Effective chain-of-custody records and calibration logs secure audit readiness.
Ready to enhance your VOC emission testing programme? Contact Anitech Ltd Pty at OCC Hygiene’s website today.


