
Quick Summary: A VOC analysis report provides data-driven identification of airborne chemicals, including auxiliary toxins, at production sites. This guide explains diagnostic testing and property screening workflows, focusing on sampling strategies, interpreting results against safety standards, and implementing controls. It details methods for tracking common chemicals from processes like manufacturing, construction, and even focused meth production, turning complex data into actionable workplace safety plans.
A VOC analysis report is your scientific roadmap to understanding and controlling airborne chemical hazards in your production facility. It takes the guesswork out of air quality by precisely identifying and measuring the Volatile Organic Compounds (VOCs) present, comparing them against safety standards to protect your team and ensure you're meeting your compliance obligations. This data-driven identification of toxins is the foundation of a proactive and effective workplace safety program.
This report is far more than a simple tick-box exercise; it's a critical tool for diagnostic testing and property screening workflows.
Decoding Your VOC Analysis Report: Identifying Key Production Chemicals
Many industrial processes—from manufacturing and pharmaceuticals to printing and mining—release VOCs into the air, often from sources you might overlook. These invisible chemicals can come from seemingly everyday activities, creating a complex chemical fingerprint within your facility.
Think about it: the use of solvents, adhesives, paints, and industrial-strength cleaning agents are all common culprits. Beyond that, processes like curing plastics, fuel combustion in machinery, or even illicit activities like focused meth production in clandestine settings can release a unique and hazardous cocktail of chemicals. Keeping track of these compounds isn't just about compliance; it's about uncovering the hidden dangers and auxiliary toxins that might be affecting your team.
Why This Report Matters for Workplace Safety
When you truly understand what's in your report, you can make informed, targeted decisions that directly protect your workers' health. The data gives you a clear snapshot of potential exposure levels, helping you pinpoint high-risk roles or specific "hotspot" areas within your facility. Without this analysis, you're essentially flying blind when it comes to long-term health hazards.
This report transforms abstract risks into measurable data. It's the difference between suspecting an air quality issue and proving it, allowing you to implement targeted controls that genuinely protect your workforce from exposure to harmful substances.
From Jargon to Actionable Insights
Let's be honest, a VOC analysis report can look intimidating at first glance, packed with chemical names, acronyms, and concentration levels. But its core purpose is straightforward: to compare the chemical fingerprint of your workplace air against established safety benchmarks. This allows you to see exactly what's there and whether it poses a risk.
Here’s a look at some of the key industries in Australia and the common VOCs you might encounter.
Common VOCs by Industry and Associated Health Risks
The table below gives an overview of prevalent Volatile Organic Compounds found in key Australian industries, their sources, and potential health effects. It's a starting point for understanding what you might find in your own operations.
| Industry Sector | Common VOCs | Primary Production Sources | Potential Health Risks |
|---|---|---|---|
| Manufacturing & Assembly | Toluene, Xylene, Styrene, Acetone | Solvents, paints, adhesives, degreasers, plastic and resin curing | Headaches, dizziness, nervous system damage, respiratory irritation |
| Printing & Publishing | Isopropyl Alcohol, Toluene, Hexane | Inks, cleaning solvents, blanket washes, fountain solutions | Skin and eye irritation, nausea, long-term organ damage |
| Construction & Painting | Benzene, Formaldehyde, Toluene | Paints, lacquers, adhesives, sealants, treated wood products | Carcinogenic (Benzene, Formaldehyde), respiratory issues, allergic reactions |
| Pharmaceuticals | Methylene Chloride, Acetone, Ethanol | Solvent extraction, chemical synthesis, cleaning of equipment | Central nervous system depression, liver and kidney damage, skin irritation |
| Automotive Repair | Xylene, Acetone, Perchloroethylene | Degreasing agents, spray paints, body fillers, brake cleaners | Neurological effects, respiratory tract irritation, potential liver damage |
This isn't an exhaustive list, but it highlights how specific processes generate distinct chemical risks. Your report will provide the precise data needed to address the hazards unique to your site.
So, what practical insights can you actually pull from the report?
- Identification of Specific VOCs: You'll find out exactly which chemicals, like benzene, toluene, or formaldehyde, are present in your air.
- Concentration Levels: The report measures the amount of each VOC, usually in parts per million (ppm) or milligrams per cubic metre (mg/m³).
- Exposure Hotspots: It helps you pinpoint specific locations or tasks where chemical concentrations are at their highest.
- Detection of Auxiliary Toxins: Sometimes, the analysis uncovers unexpected chemical by-products from production that you weren't even looking for.
Ultimately, this kind of diagnostic testing and property screening is the first, crucial step toward creating a safer environment. To get a better handle on how this data is gathered, you can learn more about the specifics in our guide on what is VOC testing. This information provides the hard evidence needed to justify changes, whether that means upgrading your ventilation, substituting safer materials, or updating your personal protective equipment (PPE) protocols.
Designing an Effective VOC Sampling Strategy
A solid VOC analysis report hinges entirely on a well-thought-out sampling strategy. Get it wrong, and you’re left with data that’s unrepresentative, misleading, or just plain useless for protecting your team. This isn't just about placing a few air pumps around your site; it's about a targeted approach to uncover the real risks tied to your local production processes.
It all starts with a preliminary site walkthrough. You need to get your boots on the ground to see the operation firsthand. The goal is to pinpoint obvious emission sources, identify tasks that carry a higher risk, and map out where your workers are most likely to be exposed. This initial survey is the foundation for a sampling plan that’s both cost-effective and delivers insights you can actually act on.
The entire process, from that initial sample to the final report, follows a clear path.
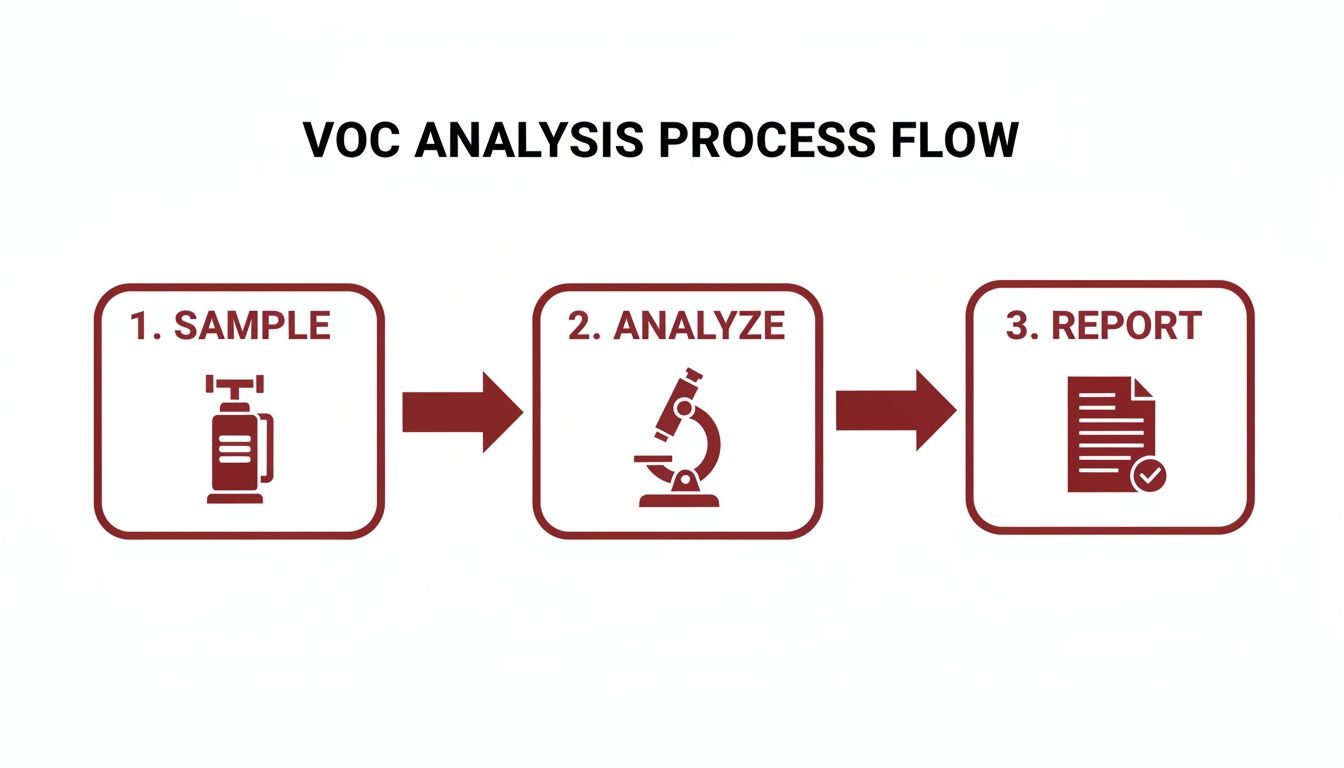
As you can see, structured sample collection is the critical first step. It feeds directly into the lab analysis and, ultimately, shapes the final, actionable report you deliver.
Differentiating Sampling Methods
With a map of potential hotspots in hand, you need to decide on the right sampling method. There's no one-size-fits-all solution here—the best choice depends entirely on what you need to measure. The three main methods we use are personal, area, and source sampling.
Understanding the difference between them is crucial for gathering relevant data. For example, if you're concerned about a welder's exposure to specific fumes inside a confined space, personal sampling is non-negotiable. But if you want to understand the general air quality near a large, open-topped mixing vat, area sampling will give you a much better picture of the ambient concentrations.
Personal Sampling: What Your Workers Are Actually Breathing
Personal sampling is the gold standard for assessing an individual's direct exposure to airborne contaminants. It involves fitting a worker with a small, lightweight sampling pump, with a collection tube positioned right in their "breathing zone"—that small area immediately around their nose and mouth.
This technique is essential for:
- High-Risk Roles: Directly measuring what individuals in roles like painters, chemical mixers, or welders are inhaling throughout their shift.
- Compliance Checks: Comparing a worker’s personal exposure directly against Safe Work Australia's Workplace Exposure Standards (WES).
- Task-Specific Analysis: Pinpointing which specific activities contribute the most to a worker's total exposure.
Area Sampling: Understanding Ambient Concentrations
Area sampling, sometimes called static or fixed-point sampling, measures the VOC concentration in a specific location rather than on a person. We set up pumps in fixed positions to get a sense of the general air quality in a room, near a particular machine, or along the facility's boundary line.
Area sampling is incredibly useful for establishing baseline environmental conditions and identifying "hotspot" zones. It helps you understand where airborne contaminants are coming from and how they disperse, giving you vital data for designing engineering controls like new ventilation systems.
This approach is perfect for monitoring:
- General Work Environments: Assessing air quality on production floors, in storage areas, or inside laboratories.
- Fugitive Emissions: Detecting slow leaks from tanks, pipes, and valves that contribute to background VOC levels.
- Control Effectiveness: Placing samplers upstream and downstream of a new ventilation system to prove it's actually working.
Source Sampling: Measuring Direct Emissions
Source sampling, often known as stack testing, is a highly specialised method used to measure the pollutants being released directly from an emission point, like an industrial chimney, exhaust stack, or process vent. This is a critical part of environmental compliance and pollution control.
This technique helps determine if your facility is meeting its regulatory emission limits and gives you the hard data needed to design or evaluate pollution control equipment. For instance, a recent study showed that routine separator maintenance at oil and gas sites led to significant VOC releases, posing risks to nearby communities. Identifying these kinds of auxiliary toxins from specific production phases is only possible through targeted source sampling.
By blending these different methods, you can build a comprehensive, multi-faceted picture of the chemical landscape at your site. This ensures your VOC analysis report is not just a compliance document, but a genuinely effective tool for safeguarding everyone's health. This information then becomes a key input for property screening workflows and diagnostic testing protocols, creating a robust, closed-loop system for managing risk.
Conducting On-Site Diagnostic Testing
Once you've got a solid plan, it's time to get your boots on the ground. Moving from paper to practice is where your VOC analysis report: tracking common chemicals associated with local production really takes shape. This isn't just about using fancy equipment; it's about mastering your tools and standardising your approach to get data that truly reflects what your workers are exposed to every day.
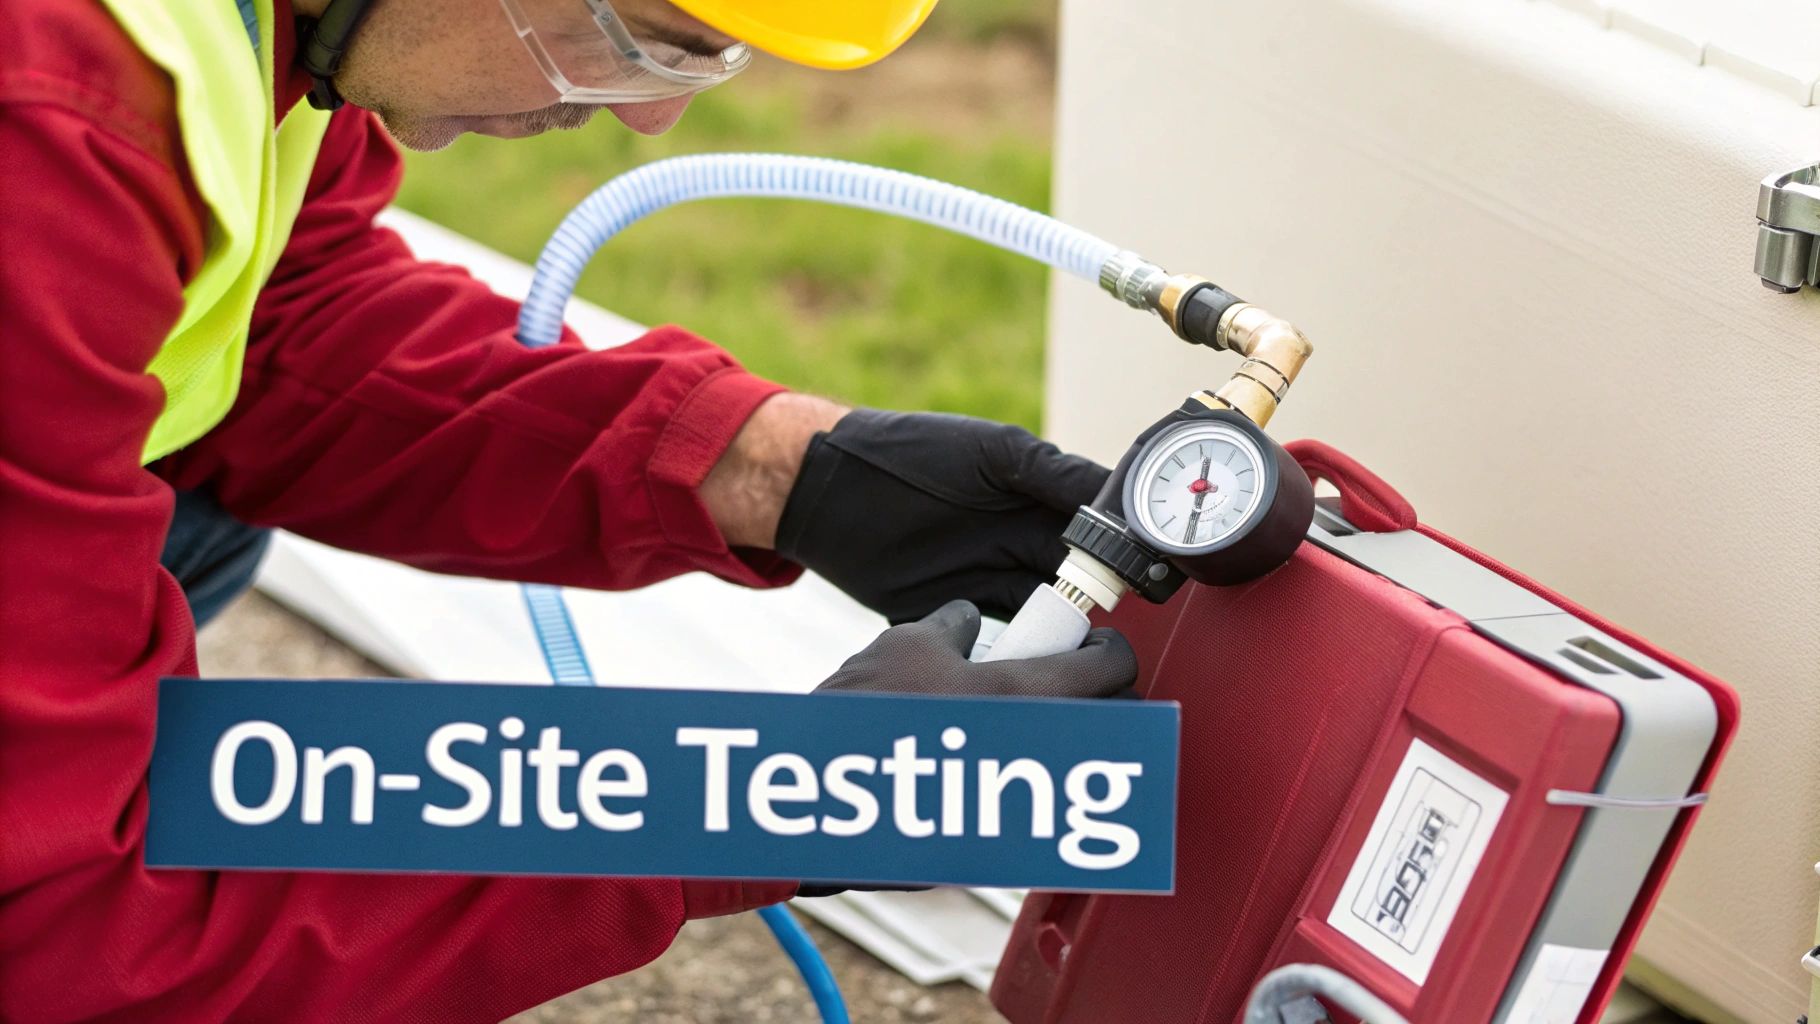
The main objective here is to capture a clean, representative air sample. To do that, you need more than just the right gear—you need to know how to use it inside and out to dodge the common mistakes that can completely invalidate your findings. Every detail, from calibrating a pump to filling out a form, demands careful attention.
Mastering Sorbent Tubes and Personal Sampling Pumps
For personal exposure monitoring, the classic and most reliable method is still the sorbent tube and personal sampling pump combination. These are small glass tubes packed with an adsorbent material, usually activated charcoal, that acts like a sponge for VOCs as air is pulled through it.
The whole process starts with meticulous calibration. Before you even think about heading to the site, every single pump needs to be calibrated with a sorbent tube in the line to make sure it’s pulling air at the exact flow rate you need. If you get this wrong, all your final concentration calculations will be off. It’s a non-negotiable first step.
Out in the field, you'll clip the pump to a worker’s belt and position the sorbent tube right in their breathing zone—that small bubble of air around their nose and mouth. This setup typically runs for an entire shift to give you a time-weighted average (TWA) exposure. This is crucial because it tells you what that person is actually inhaling over a full workday, not just at one moment in time.
Real-Time Screening with Direct-Reading Instruments
While sorbent tubes are the gold standard for detailed lab analysis, sometimes you need answers now. That's where direct-reading instruments, like Photoionization Detectors (PIDs), are absolute lifesavers. A PID zaps airborne VOCs with high-energy UV light, which ionises them and creates a tiny electrical current that gives you a real-time reading of the total VOC concentration.
PIDs are brilliant for a few key tasks:
- Finding Hotspots: You can quickly walk through an area and pinpoint the source of a leak or high emissions.
- Confined Space Checks: They’re essential for getting a quick safety check before anyone enters a tank or other enclosed space.
- Initial Screening: A PID gives you a fast, ballpark reading that helps you decide where to place your more precise (and expensive) sorbent tube samples.
Just remember, a PID gives you a total VOC reading; it won't tell you if you're smelling benzene or isopropanol. Think of it as a highly effective screening tool that points you in the right direction for more detailed investigation.
To provide a clearer picture, let's compare some of these common approaches.
Comparison of VOC Sampling and Analysis Methods
This table offers a comparative look at common methodologies for VOC detection, highlighting their ideal applications, advantages, and limitations.
| Method | Primary Application | Key Advantage | Considerations |
|---|---|---|---|
| Sorbent Tubes with GC-MS | TWA personal exposure monitoring, compliance reporting | Highly specific and sensitive; identifies individual chemicals | Requires lab analysis; results are not immediate |
| Photoionization Detectors (PID) | Real-time screening, hotspot identification, leak detection | Instantaneous results; portable and easy to use | Non-specific (measures total VOCs); requires calibration for specific compounds |
| Canisters (e.g., Summa) | Grab sampling, area monitoring, soil gas surveys | Captures a whole air sample; good for a wide range of VOCs | Can be bulky; may require sub-atmospheric pressure sampling |
| Colorimetric Detector Tubes | Quick spot checks for specific known chemicals | Simple, low-cost, and provides an immediate visual indication | Lower accuracy; susceptible to interferences from other chemicals |
Ultimately, the best strategy often involves a combination of these methods—using a PID for initial screening and then deploying sorbent tubes for detailed, compliant analysis in the areas of concern.
Avoiding Common Sampling Errors
Even seasoned professionals can make simple mistakes that ruin a sample. The two biggest culprits are usually sample breakthrough and contamination.
Sample breakthrough is what happens when the sorbent tube gets overloaded. The adsorbent material becomes saturated, and any additional VOCs just pass straight through without being captured. This is a risk if you sample for too long or if concentrations are way higher than you expected. Most tubes have a backup section that helps you spot this after the fact.
Contamination is another huge risk. It can come from anywhere—residue on your hands, storing tubes in your vehicle next to the fuel can, or not capping them quickly enough. Always wear clean gloves, cap tubes immediately, and store them in a clean, isolated container. For complex lab work, understanding the proper use of equipment like laboratory fume hoods is also fundamental to preventing cross-contamination and ensuring analyst safety.
Maintaining an Unbroken Chain of Custody
If you need your data to stand up to scrutiny, the chain of custody is your most important piece of paperwork. It’s a formal document that creates an unbroken timeline, tracking the sample from collection to lab analysis and logging every person who touches it along the way.
A proper chain of custody form must include:
- Unique sample ID numbers
- Exact collection dates and times
- Recorded flow rates and total sample volumes
- Signatures from everyone who handles the samples
Skipping this or doing it sloppily can get your results thrown out, especially for regulatory or legal purposes. It’s a simple but absolutely critical step that proves the integrity of your entire fieldwork effort.
Right, so the samples have been taken, the lab has done its work, and now you’re holding the report. This is where the rubber meets the road. All those numbers and chemical names can look pretty intimidating, but this is the data that will tell you what’s really going on in your workplace air. It’s time to translate those raw figures into a clear story about risk and, most importantly, how to manage it.
First things first, you need a benchmark. In Australia, our primary reference is the Workplace Exposure Standards (WES) published by Safe Work Australia. These aren't just arbitrary numbers; they are the legally enforceable limits designed to protect nearly all workers from the harmful health effects of airborne chemicals over a working lifetime.
Getting to Grips with Workplace Exposure Standards
It's crucial to understand that the WES isn't a single number. Exposure and risk are complex, so the standards are broken down to reflect how different chemicals affect the body over different timeframes.
Time-Weighted Average (TWA): This is your bread and butter. The TWA is the average concentration a worker can be exposed to over a standard eight-hour workday and a five-day week without adverse effects. Think of it as the standard for managing long-term, chronic health risks from day-in, day-out exposure.
Short-Term Exposure Limit (STEL): This one’s for the fast-acting stuff. The STEL is a 15-minute time-weighted average that should never be exceeded. It’s designed to protect workers from chemicals that can cause immediate or acute effects like irritation, dizziness, or other central nervous system impacts, even if the eight-hour TWA is well within limits.
Peak Limitation: This is the most stringent limit, reserved for the most dangerous, rapidly acting substances. It represents a maximum concentration that should never be exceeded for even a moment.
So, when you're looking at your results, context is everything. A full-shift personal sample for xylene? You’ll be comparing that to the TWA. But a 15-minute spot sample for toluene taken during a high-risk task? That needs to be checked against the STEL.
The Complication of Chemical Cocktails
Let's be realistic – it's rare to find just one VOC in a production environment. Your report will likely show a mix of different chemicals. This is where things get a bit more complex. If you have several chemicals that attack the same part of the body (like various solvents affecting the central nervous system), their effects can add up.
You can't just tick them off one by one and say they're all under the limit. An experienced occupational hygienist will calculate a "mixture exposure value." This formula assesses the combined, or additive, effect. It’s entirely possible for every single chemical to be below its individual WES, but for the mixture as a whole to present an unacceptable health risk.
The big takeaway here is that compliance isn't just about avoiding an exceedance. A truly protective approach requires looking at the bigger picture and understanding the combined impact of everything in the air.
What 'Not Detected' Really Means
Seeing 'Not Detected' or 'Below Limit of Reporting' (LOR) on your report feels like a win, and usually, it is. It means the concentration was so low that the lab's highly sensitive equipment couldn't reliably measure it.
However, don't just skim past it. You need to check what the lab's reporting limit actually is. For a highly toxic substance with a very low WES, a high LOR might not be good enough to prove the environment is safe. It’s a small detail, but an important one for due diligence.
Finding the Unexpected: Auxiliary Toxins and By-Products
A thorough voc analysis report is more than a simple pass/fail test. It's a diagnostic tool. Often, it helps you spot the things you weren't looking for: the auxiliary toxins or chemical by-products created during your processes.
For example, you might be using a specific resin and know to test for its main components. But the heat from your process could be breaking it down into entirely different, and potentially more hazardous, compounds you hadn't considered. This is how you uncover those hidden risks.
This kind of deep analysis also helps you place your site within the broader environmental context. We know that industrial VOC trends in regions like Southeastern Australia have a significant impact on local air quality and ozone formation. With the Basic Inorganic Chemical Manufacturing sector growing, keeping a close eye on emissions is more important than ever. We specialise in taking that broad, regional data and turning it into specific, actionable safety strategies for your individual site. If you're interested in the macro trends, you can find more insights on the growth of chemical manufacturing on ibisworld.com.
By looking at every compound the lab identifies, you shift from a reactive compliance mindset to a proactive safety culture, using data to make your workplace safer.
Turning Raw Data into an Actionable VOC Report
Once the lab sends back the results, you're not done. You've just got a pile of raw data. The real work begins now: translating those complex scientific findings into a clear, compliant, and actionable VOC analysis report. Think of this document as your primary communication tool. It’s the bridge between technical measurements and meaningful safety improvements that everyone, from the plant manager to the CEO, can understand and act on.
The aim here is to move beyond just listing numbers on a page. A truly effective report tells a story. It highlights trends, pinpoints problem areas, and, crucially, lays out a clear path forward with practical, achievable recommendations.
The Anatomy of a Professional Report
A strong report needs a logical structure so that critical information is easy to find and digest. Sticking to a consistent format builds credibility and ensures you cover all the bases.
Here are the core components every report should have:
Executive Summary: This is your "at-a-glance" section and, frankly, the most important part. It's a high-level overview of the entire report, hitting the key findings and the most urgent recommendations. Be direct and impactful here; many senior leaders will only read this.
Introduction and Objectives: Set the scene. Why was this monitoring done in the first place? Was it a routine check, a response to worker complaints, or part of a compliance audit? State your goals clearly.
Methodology: This is where you detail the "how." Describe your sampling strategy (personal, area, or source), the equipment you used (like sorbent tubes with GC-MS), how long you sampled for, and your calibration process. Transparency here is key to building trust in your results.
Results and Discussion: The heart of your report. Present the data clearly, usually in tables that compare your measurements directly against the relevant Workplace Exposure Standards (TWA and STEL). This is also where you interpret the data—discuss any readings that exceeded the limits, point out trends, or note any unexpected findings.
Recommendations: This section is what turns your data into action. Provide clear, practical steps to fix the problems you've identified.
Bring Your Data to Life with Visuals
Let's be honest, walls of text and dense tables are hard to get through. They can easily bury the most important findings. This is where charts and graphs become your best friend, making your VOC analysis report far more persuasive and accessible, especially for a non-technical audience.
A few simple visuals can instantly highlight problem areas and make trends pop:
- Bar Charts: Perfect for comparing exposure levels across different job roles or work areas. You can quickly see which teams are at the highest risk.
- Line Graphs: Great for showing how VOC levels change over time or during a specific process. This is incredibly useful for tracking whether a new control measure is actually working.
- Site Maps: A colour-coded map of your facility can be a powerful tool. It visually pinpoints "hotspots" where concentrations are highest, helping you target your efforts precisely.
Writing Recommendations That Actually Work
The whole point of this exercise is to drive real change. That means your recommendations need to be specific, practical, and prioritised based on the hierarchy of controls. This isn't just a textbook concept; it's a proven safety principle that forces you to aim for the most effective solutions first.
The hierarchy of controls is more than just a best practice—it’s a strategic framework for risk reduction. It makes you consider eliminating or substituting a hazard before you even think about less effective measures like PPE. It’s all about addressing the root cause, not just the symptom.
When you write your recommendations, follow this order:
- Elimination/Substitution: The gold standard. Can you get rid of the hazardous chemical entirely or swap it for a safer alternative?
- Engineering Controls: If you can't substitute, can you physically change the workplace to isolate people from the hazard? Think local exhaust ventilation or enclosing a process.
- Administrative Controls: Can you change how people work? This might involve rotating jobs to limit exposure time or introducing new safe work procedures.
- Personal Protective Equipment (PPE): This should always be your last resort. If you must recommend PPE, be specific about the type needed (e.g., respirators with organic vapour cartridges) and explain why higher-level controls aren't feasible.
A fantastic real-world example of substitution is the growing use of low-VOC and bio-based solutions for green construction. By opting for these materials, you're directly applying the most effective control. This isn't just a niche trend; Australia's construction chemicals market hit USD 1.2 billion in 2024 and is projected to soar to USD 2.1 billion by 2033. This growth is fuelled by green building standards and major infrastructure projects that demand products compliant with strict VOC limits, reflecting a nationwide shift toward safer, more sustainable local production. You can read more about Australia's construction chemicals market trends at imarcgroup.com.
Answering Your Questions About VOC Analysis
When you dive into the world of occupational hygiene, a few common questions always seem to pop up, especially around something as detailed as a VOC analysis report. If you're responsible for a local production site, you're likely juggling terms and processes that can feel a bit technical. Let's clear up some of the most frequent queries we hear from businesses working to protect their teams.
Most of the time, these questions are about the practical side of things: how often to test, what the different chemical terms really mean, and what to do if the results aren't what you hoped for. Getting a handle on these basics is the first step toward making confident safety decisions for your workplace.
How Often Should We Be Testing for VOCs?
This is easily one of the most common questions, and the honest answer is: it depends. There’s no single, legally mandated schedule that fits every business. The right frequency for VOC testing comes down to your specific operations and the level of risk involved.
A risk-based approach is always the best way forward. Think of it less as a fixed calendar date and more about responding to specific triggers. You should definitely be thinking about a new round of VOC analysis when:
- You introduce new chemicals or processes. Bringing in a new solvent, adhesive, or changing up a production method can introduce completely new airborne hazards.
- Production volumes change significantly. Ramping up output might mean higher VOC concentrations, even if the core process stays the same.
- Workers raise health concerns. If your team reports recurring headaches, dizziness, or respiratory irritation, that’s a massive red flag to investigate immediately.
- It’s time for a routine audit. Many businesses build VOC testing into their annual or biennial safety audits. It’s a great proactive way to stay on top of things.
A great starting point is to conduct an initial baseline assessment to understand your starting point. From there, you can re-evaluate every time a significant operational change happens. It's the only way to ensure your safety measures are keeping up with your business.
What's the Difference Between VOCs and Auxiliary Toxins?
It’s easy to get these terms mixed up, but the distinction is really important for understanding what your report is telling you.
A Volatile Organic Compound (VOC) is the primary chemical you’re using or know you’re creating. Think of the toluene in a solvent or the styrene used in fibreglassing—these are the "knowns" on your safety data sheets.
An auxiliary toxin, however, is often an unexpected by-product. It can be created when primary chemicals react with one another, degrade under heat, or interact with something else in the work environment. A classic example is heating certain plastics, which can release nasty compounds that weren't in the original material. Your VOC analysis is what uncovers these hidden dangers.
What Do We Do if We Exceed an Exposure Standard?
First things first: if your report shows a result above a Workplace Exposure Standard (WES), you have a legal and ethical duty to act straight away. Ignoring it isn't an option. It can lead to serious penalties and, far more importantly, puts your people’s health at risk.
When a result comes back over the limit, it’s all hands on deck. You need a clear, structured plan to get things back to a safe level quickly and effectively.
Here's the plan of attack you should follow:
- Stop the Task: If there's an immediate risk, stop the activity causing the high exposure.
- Find the Cause: Dig in and figure out why it happened. Was it a breakdown in the ventilation system? Did someone use an incorrect procedure? Was there a spill?
- Implement Controls: Fix the problem using the hierarchy of controls. That means prioritising engineering solutions like better ventilation before just handing out more PPE.
- Re-test: Once your new controls are in place, you absolutely must test again to prove they've worked and brought the exposure down to a safe level.
- Document Everything: Keep a clear paper trail of the exceedance, your investigation, the actions you took, and the results of your follow-up testing.
Can We Use Real-Time Monitors for Compliance?
Real-time monitors, like Photoionization Detectors (PIDs), are brilliant tools. They’re fantastic for quick screening, finding potential hotspots, and getting an immediate feel for what’s in the air.
However, in Australia, they generally cannot be used for standalone compliance reporting.
While they give you valuable instant feedback, most PIDs measure total VOCs and can't distinguish between specific chemicals. To comply with Safe Work Australia’s WES, you need to identify and measure individual chemical compounds. That level of detail only comes from proper laboratory analysis of samples, usually collected on sorbent tubes. So, think of real-time monitors as a powerful partner to formal lab analysis, not a replacement for it.
Our multi-disciplinary experts provide the scientific rigour and practical guidance needed to navigate every step of the VOC analysis process. From designing a robust sampling strategy to interpreting complex results and creating actionable reports, we help you build a safer, healthier, and more compliant workplace. Visit us at https://occhygiene.com.au to learn how we can support your business.


