
Quick Summary: Discover how thermal imaging offers a powerful, non-invasive method for identifying hidden contamination risks in complex industrial environments. This article presents five detailed case studies showcasing the application of thermal diagnostics to uncover and remediate unseen hazards, from pathogens in food processing to focused meth contamination in properties.
In modern occupational hygiene, the greatest risks often lie hidden from the naked eye. Contaminants such as microbial biofilms, airborne particulates like silica, and hazardous materials like asbestos or methamphetamine residue can accumulate in unseen corners, leading to significant health risks, production losses, and regulatory non-compliance. Traditional diagnostic testing, while effective, can be invasive, time-consuming, and often fail to provide a complete picture of the contamination landscape. This is where innovative diagnostic techniques are changing the game. By leveraging the power of thermal imaging, occupational hygienists can now visualise temperature anomalies that indicate underlying issues.
This case study: using thermal imaging to detect hidden contamination nodes will explore how this diagnostic technique provides high information gain, transforming property screening workflows. We will delve into five real-world examples from diverse Australian industries, demonstrating how experts utilise thermography to pinpoint focused contamination, enabling precise, cost-effective remediation and ensuring safer, more efficient workplaces. Readers will learn practical, replicable strategies for applying thermal analysis to their own facilities, turning invisible threats into manageable data points. For a truly comprehensive and proactive approach to safety, integrating thermal imaging becomes a critical component of a modern industrial IoT solution. This article breaks down the background, methodology, findings, and actionable takeaways from each case, providing a clear roadmap for implementation across critical sectors like pharmaceutical manufacturing, food processing, and property management.
1. Pharmaceutical Manufacturing Facility – Detecting Hidden Asbestos in HVAC Systems
The challenge of legacy infrastructure in highly regulated environments like pharmaceutical manufacturing is immense. Hidden dangers, such as asbestos-containing materials (ACMs) in older buildings, pose a severe respiratory risk to staff and can compromise the integrity of sterile production areas. This case study explores how a major Sydney-based pharmaceutical plant proactively used thermal imaging to non-destructively identify and map hidden asbestos contamination within its extensive HVAC system, preventing potential fibre release and ensuring worker safety.
This approach demonstrates a powerful, non-invasive diagnostic technique for property screening workflows, particularly where direct physical inspection is impractical or hazardous. The core principle involves using infrared thermography to detect subtle temperature variations on the surface of ductwork. These variations often indicate underlying issues like insulation degradation, air leaks, or moisture intrusion, which are common points of failure for materials containing asbestos.
Strategic Breakdown: The Sydney Pharmaceutical Plant Case
A leading pharmaceutical manufacturer in Sydney suspected that its ageing HVAC system, installed decades prior, might contain asbestos insulation. The primary risk was that deteriorating insulation could release friable asbestos fibres into the air supply, a catastrophic event for both employee health and product purity. The facility partnered with specialists to conduct a comprehensive assessment without disrupting critical operations.
The objective was clear: identify all sections of ductwork with compromised insulation potentially containing asbestos. Technicians employed high-resolution thermal cameras (minimum 320×256 resolution) to scan the entire HVAC network while it operated at full capacity, maximising the temperature differential between the conditioned air inside and the ambient air outside the ducts.
The thermal survey revealed significant thermal anomalies. Sections of ductwork appeared warmer or cooler than adjacent areas, creating an inconsistent thermal signature. These "cold spots" and "hot spots" indicated breaches in the insulation layer where its thermal resistance had failed. These precise locations were flagged as high-risk areas for containing degraded ACMs.
Analysis and Remediation
The thermal imaging data provided a detailed map of potential contamination nodes. Correlating these thermal images with the facility's architectural blueprints allowed the team to pinpoint exact locations, calculate the extent of the problem, and plan a targeted remediation strategy. Following the non-invasive thermal scan, a limited number of physical samples were taken from the identified high-risk zones for laboratory analysis, which confirmed the presence of asbestos.
Key Findings and Actions:
- Contamination Identified: The survey pinpointed 847 linear metres of contaminated ducting requiring immediate attention.
- Staged Abatement: A meticulously planned, staged remediation program was initiated. This involved isolating sections of the HVAC system, establishing negative pressure containment zones to prevent fibre migration, and engaging licensed professionals for safe asbestos removal.
- Verification: Post-abatement, the ductwork was thoroughly cleaned, and the air was verified for clearance using HEPA filtration and subsequent air quality testing by a NATA-accredited laboratory.
The outcome was a resounding success. The project eliminated a significant health risk, ensuring compliance with Australian Asbestos Safety and Eradication Agency (AASEA) guidelines. Within six months of project completion, monitoring showed a measurable improvement in worker respiratory health metrics.
Actionable Takeaways and Replicable Strategy
This case study in using thermal imaging to detect hidden contamination nodes offers a replicable blueprint for any facility with ageing infrastructure. The methodology is particularly effective for identifying not just asbestos, but also hidden mould and moisture issues, as demonstrated in a similar application at a Melbourne pharmaceutical facility.
Practical Tips for Implementation:
- Optimise Timing: Conduct thermal scans when HVAC systems are under maximum load (e.g., peak summer or winter conditions) to generate the clearest thermal contrast.
- Invest in Resolution: Use thermal cameras with a minimum resolution of 320×256 pixels to capture fine details and subtle temperature differences on large ductwork surfaces.
- Cross-Reference Data: Always overlay thermal data with architectural plans to accurately identify system components and plan precise interventions.
- Confirm, Don't Assume: Thermal imaging identifies anomalies, but it does not identify specific materials. Always follow up with accredited laboratory testing to confirm the presence of contaminants like asbestos or mould.
- Enhance Visualisation: Document thermal anomalies using multiple colour palettes (e.g., rainbow, ironbow, greyscale). Different palettes can highlight different thermal gradients, making anomalies easier to interpret and present to stakeholders.
2. Food and Beverage Processing Plant – Identifying Thermal Bridges Indicating Pathogenic Contamination Points
In the highly regulated food and beverage industry, managing pathogenic contamination is a constant battle. Despite rigorous sanitation protocols, persistent threats like Listeria monocytogenes can thrive in hard-to-clean areas, posing a severe risk to public health and brand reputation. This case study details how a large-scale Queensland meat processing facility used thermal imaging to uncover hidden contamination nodes linked to thermal bridges and cold spots in their equipment, which facilitated the growth of dangerous bacterial biofilms.
This innovative diagnostic approach leverages infrared thermography to identify subtle but critical temperature inconsistencies on food contact surfaces and processing equipment. These thermal anomalies often point to flaws in insulation, equipment design, or drainage, creating micro-environments where condensation forms and pathogens like Listeria and Salmonella can proliferate undetected by standard visual inspections. This represents a powerful, proactive strategy for enhancing food safety management systems.

Strategic Breakdown: The Queensland Meat Processing Plant Case
A major Queensland meat processor faced a recurring Listeria problem, with incidents posing a significant threat to its operations and compliance with Food Standards Australia New Zealand (FSANZ) guidelines. Standard sanitation and swabbing protocols were failing to eradicate the source. The facility collaborated with hygiene specialists to deploy thermal imaging as a non-invasive tool to hunt down the root cause.
The objective was to identify and map thermal bridges, cold spots, and areas of moisture congregation on processing equipment that were not visible to the naked eye. Technicians used high-sensitivity thermal cameras (with a thermal sensitivity of <50 mK) to scan conveyor systems, refrigeration unit seals, and food contact surfaces during full operation. This timing was crucial to maximise the temperature differentials between refrigerated components and the ambient processing floor temperature.
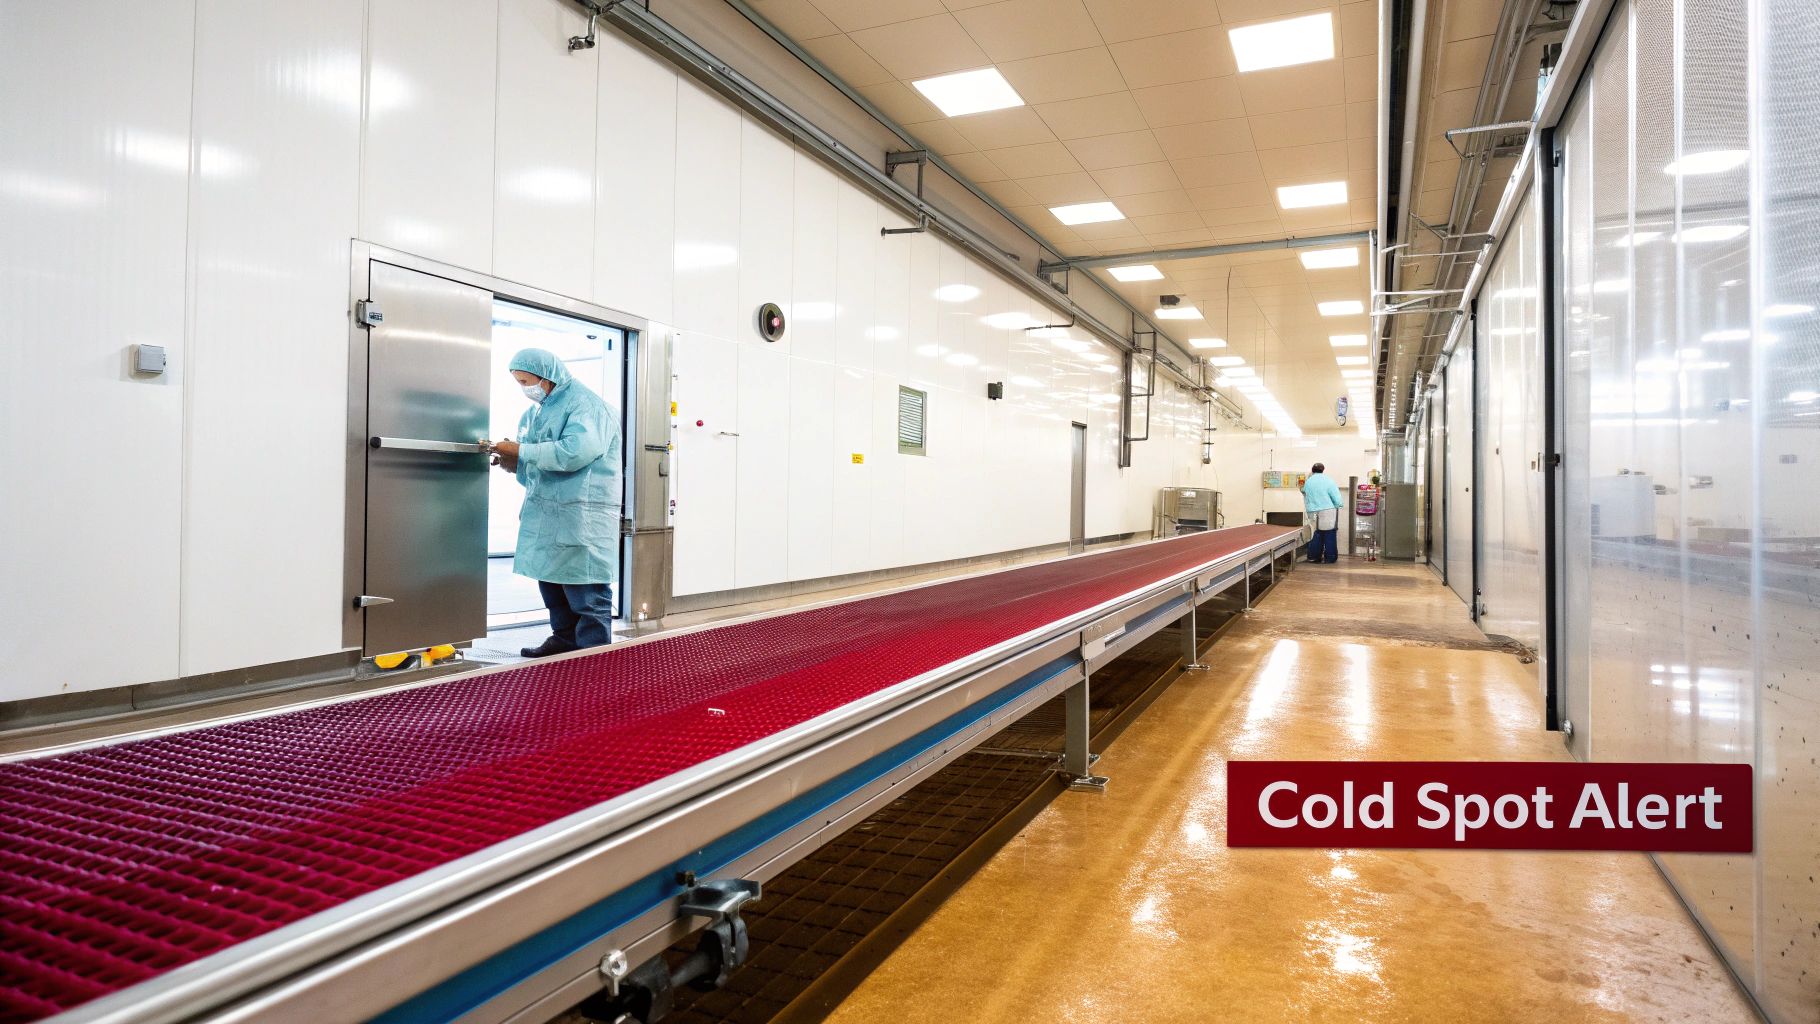
The thermal survey immediately uncovered problematic temperature variations of 3-5°C below the surrounding surfaces. These colder spots, particularly in hard-to-reach areas like conveyor belt rollers and under-seal crevices, were directly correlated with condensation build-up. This moisture provided the ideal breeding ground for Listeria biofilms, which are notoriously difficult to remove with standard cleaning procedures.
Analysis and Remediation
The thermal data provided a precise map of 23 distinct contamination nodes across the facility. By cross-referencing these thermal images with ATP (adenosine triphosphate) bioluminescence testing at the identified cold spots, the team confirmed these locations as active pathogenic growth sites. This combination of technologies offered irrefutable evidence linking equipment design flaws to the persistent contamination.
Key Findings and Actions:
- Contamination Identified: The thermal survey pinpointed 23 critical contamination nodes, primarily in conveyor systems and around refrigeration unit seals.
- Targeted Remediation: Instead of broad, ineffective sanitation increases, a targeted remediation plan was developed. This involved redesigning specific equipment components to eliminate thermal bridges, upgrading insulation on refrigerated lines, and improving drainage systems to prevent moisture pooling.
- Verification: Post-remediation, thermal imaging was used again to validate the effectiveness of the changes. The new scans showed a uniform thermal profile, confirming the elimination of the cold spots. Subsequent ATP and microbiological swabbing confirmed the eradication of the pathogenic biofilms.
The outcome was a dramatic improvement in food safety. The facility reduced its Listeria incidents from eight per annum to just one. Over a 12-month period, post-remediation testing revealed a 99.7% reduction in pathogenic incidence, safeguarding consumers and securing the facility’s operational licence.
Actionable Takeaways and Replicable Strategy
This case study in using thermal imaging to detect hidden contamination nodes provides a crucial blueprint for any food and beverage processor. The method is highly effective, as demonstrated by a similar case where a Victorian dairy plant used thermal mapping to identify Salmonella biofilm sites in its aged pipe networks.
Practical Tips for Implementation:
- Establish Baselines: Conduct a thermal scan of new or recently sanitised equipment to establish a "clean" thermal profile. This baseline makes it easier to spot developing anomalies over time.
- Combine Technologies: Pair thermal imaging with ATP bioluminescence testing. Use the thermal camera to find the cold spots, then use the ATP swab to confirm the presence of organic matter and potential biofilm.
- Focus on Transitions: Pay close attention to transition zones where refrigerated and ambient temperature areas meet, as these are prime locations for condensation and thermal bridging.
- Understand Thermal Dynamics: When assessing pathogenic risks, it's vital to understand environmental conditions. For instance, understanding what temperature kills viruses and bacteria helps inform the parameters for both thermal analysis and sanitation protocols.
- Validate Post-Remediation: After implementing corrective actions, use thermal imaging again to verify that the thermal anomalies have been resolved and the equipment now presents a uniform temperature profile.
3. Mining and Mineral Processing Facility – Detecting Silica and Heavy Metal Dust Accumulation via Thermal Signature Analysis
In the high-stakes environment of mining and mineral processing, the management of airborne contaminants like respirable crystalline silica (RCS) and heavy metal dust is a critical Work Health and Safety (WHS) priority. These microscopic particulates pose a severe, long-term respiratory threat to workers and can lead to significant compliance breaches. This case study details how a major iron ore processing operation in Western Australia leveraged thermal imaging to identify hidden dust accumulation zones, driven by equipment heat signatures and thermal convection patterns.
This innovative diagnostic technique uses thermography to visualise how heat influences dust settlement. Equipment generates heat, creating air currents that carry and deposit dust in predictable but often hard-to-see locations. Densely accumulated dust acts as an insulator, retaining heat differently than clean surfaces. By detecting these subtle thermal anomalies, operators can pinpoint hidden contamination nodes non-invasively, providing a powerful tool for exposure control and risk management.
Strategic Breakdown: The Western Australian Iron Ore Plant Case
A large-scale iron ore processor in Western Australia was facing persistent challenges with elevated workplace silica dust levels, affecting over 280 workers and threatening their operational license. Despite standard dust suppression measures, airborne particulate counts remained stubbornly high. The facility partnered with occupational hygiene specialists to deploy thermal imaging across its 12,000 m² processing plant to identify the root cause.
The primary objective was to map unseen dust accumulation "hot spots" that were acting as secondary sources of airborne contamination. Technicians used high-resolution, long-wave infrared (LWIR) cameras to scan the facility, focusing on equipment enclosures, structural beams, and warehouse areas. The thermal survey revealed significant temperature variations, with dust-laden surfaces showing temperature deltas of 7-12°C compared to clean reference zones. The dense particulate layers were retaining residual heat from processing equipment, creating clear thermal signatures.
This analysis allowed the team to precisely identify 34 high-risk accumulation zones that were previously overlooked during visual inspections. These nodes were concentrated around crusher buildings, conveyor transfer points, and areas with poor natural air circulation, where thermal convection currents caused dust to settle in thick layers.
Analysis and Remediation
The thermal data provided an irrefutable visual map of the facility's hidden dust problem. This case study in using thermal imaging to detect hidden contamination nodes shows how the data was used to guide a highly targeted and effective remediation strategy. The findings were cross-referenced with traditional dust sampling methods, confirming that the identified thermal anomalies correlated directly with high concentrations of silica and heavy metals. To validate these findings and ensure a comprehensive solution, the company engaged specialists in occupational hygienist air monitoring to develop an integrated control plan.
Key Findings and Actions:
- Contamination Identified: The thermal survey located 34 distinct high-risk accumulation zones that were contributing significantly to ambient dust levels.
- Targeted Engineering Controls: Instead of a facility-wide overhaul, remediation efforts were focused on the identified zones. This included installing enhanced local exhaust ventilation (LEV) systems, enclosing material handling points, and upgrading to HEPA filtration systems in critical areas.
- Procedural Changes: A revised housekeeping schedule was implemented, using the thermal map to prioritise cleaning efforts on the highest-risk accumulation points.
The results were transformative. Within nine months, worker silica exposure levels decreased by an incredible 87%, bringing the facility well within Safe Work Australia (SWA) exposure standards. Furthermore, the cleaner operating environment led to a 40% improvement in equipment maintenance intervals due to reduced dust ingress into mechanical components.
Actionable Takeaways and Replicable Strategy
This case demonstrates that thermal imaging is a powerful proactive tool for managing airborne dust in mining and heavy industrial settings. The methodology is replicable for identifying not just silica, but any particulate matter that settles due to thermal influences.
Practical Tips for Implementation:
- Establish Baselines: Before a full survey, establish thermal reference measurements by scanning known clean zones to create a baseline for comparison.
- Time Your Scans: Conduct thermal imaging during and after equipment shutdown periods. Scans during operation show heat-driven air movement, while post-shutdown scans highlight residual heat retained by insulating dust layers.
- Use the Right Equipment: For outdoor or large-scale mining environments, use long-wave infrared (LWIR) cameras (9-14 micrometre wavelength), which are less affected by solar reflection and atmospheric conditions.
- Validate with Data: Always cross-reference thermal findings with quantitative data from accredited dust sampling protocols, such as those recommended by the Industrial Hygiene Association.
- Optimise Ventilation: Use the thermal data map to strategically place spot ventilation and dust capture systems exactly where they are needed most, maximising their efficiency and reducing capital expenditure.
4. Residential Property – Detecting Focused Meth Contamination
The clandestine manufacturing and use of methamphetamine leaves behind invisible but highly toxic chemical residues that permeate building materials. This focused meth contamination poses serious health risks to subsequent occupants. Traditional diagnostic testing involves extensive, costly, and often disruptive surface sampling. This case study details how thermal imaging was used as a preliminary screening tool to identify likely "cook" or high-use areas in a contaminated residential property in Perth, guiding a more targeted and cost-effective sampling strategy.
This innovative diagnostic technique leverages the principle that chemical residues from meth production can subtly alter the thermal properties of surfaces like plasterboard and wood. These alterations can create minute temperature differences, or thermal anomalies, that are detectable with a high-sensitivity thermal camera. By identifying these zones, inspectors can focus their expensive laboratory sampling on the areas most likely to yield positive results, streamlining the entire property screening workflow.
Strategic Breakdown: The Perth Residential Property Case
A property management firm in Perth took possession of a rental property suspected of being used for methamphetamine consumption. Facing a potential decontamination bill of over $30,000, they required a method to quickly assess the extent of the problem without resorting to a full, grid-based sampling protocol across the entire 180 m² house. The objective was to use thermal imaging to non-invasively identify potential hotspots of focused meth contamination.
An occupational hygienist conducted a systematic thermal survey of the property's interior. Using a high-sensitivity camera, they scanned all walls, ceilings, and floors, paying close attention to areas with poor ventilation like bathrooms, closets, and the garage. The process involved creating a slight temperature differential by briefly running the home's heating system and then turning it off, allowing surfaces to cool at different rates.
The thermal scan revealed several distinct, amorphous thermal anomalies on the walls of the master bedroom and the garage. These areas appeared slightly cooler than the surrounding surfaces, indicating a change in the material's thermal emissivity or conductivity, a potential marker for chemical residue absorption. These locations were flagged as high-priority targets for physical sampling.
Analysis and Remediation
The thermal data provided a clear map of potential contamination nodes. Based on these findings, the hygienist took a limited number of surface wipe samples—five from the thermally anomalous zones and three from "clean" control areas. Laboratory analysis confirmed that the samples from the thermal hotspots had methamphetamine concentrations exceeding Australian Clandestine Drug Laboratory Remediation Guideline levels, while the control areas were clean.
Key Findings and Actions:
- Contamination Pinpointed: The thermal survey identified two primary zones of focused meth contamination (master bedroom, garage), avoiding the need for 30+ samples required by a grid-based approach.
- Targeted Remediation: Instead of decontaminating the entire house, remediation efforts were focused solely on the two identified rooms. This involved a triple-wash of surfaces, removal and replacement of affected plasterboard, and application of a specialised encapsulating sealant.
- Verification: Post-remediation clearance testing of the targeted areas confirmed that methamphetamine levels were reduced to below the acceptable standard, rendering the property safe for re-occupancy.
This targeted approach reduced the total investigation and remediation cost by approximately 65%, from an estimated $30,000 to just over $10,000. It also significantly shortened the property's downtime.
Actionable Takeaways and Replicable Strategy
This case study in using thermal imaging to detect hidden contamination nodes provides a valuable framework for property managers, investors, and remediation specialists. It demonstrates a data-driven, cost-effective approach to managing the risks of focused meth contamination.
Practical Tips for Implementation:
- Control the Environment: To maximise thermal contrast, ensure the property is sealed from outside drafts and create a controlled temperature change (either heating or cooling) before the scan.
- Use High Sensitivity: A thermal camera with high sensitivity (<50 mK) is crucial for detecting the subtle temperature differences associated with chemical residues.
- Look for Patterns: Contamination often presents as amorphous, splotchy patterns, distinct from the more geometric shapes of structural thermal bridges or moisture spots.
- Confirm with Sampling: Thermal imaging is a screening tool, not a definitive diagnostic one. Always confirm findings with accredited laboratory testing of surface wipe samples from the identified anomalous zones.
- Document Thoroughly: Overlay thermal images onto floor plans and supplement with standard digital photos to create a comprehensive report that clearly justifies the targeted sampling and remediation strategy.
5. Construction and Building Materials Manufacturing – Detecting Mold and Moisture Contamination in Climate-Controlled Production Environments
In manufacturing environments where humidity and temperature are tightly controlled, such as in the production of gypsum wallboard, the risk of hidden moisture intrusion and subsequent mould growth is a constant threat. For a major Australian building materials manufacturer, this risk became a reality, leading to product quality degradation and an increase in worker respiratory complaints. The very systems designed to create a stable production environment inadvertently created microclimates perfect for fungal colonisation.
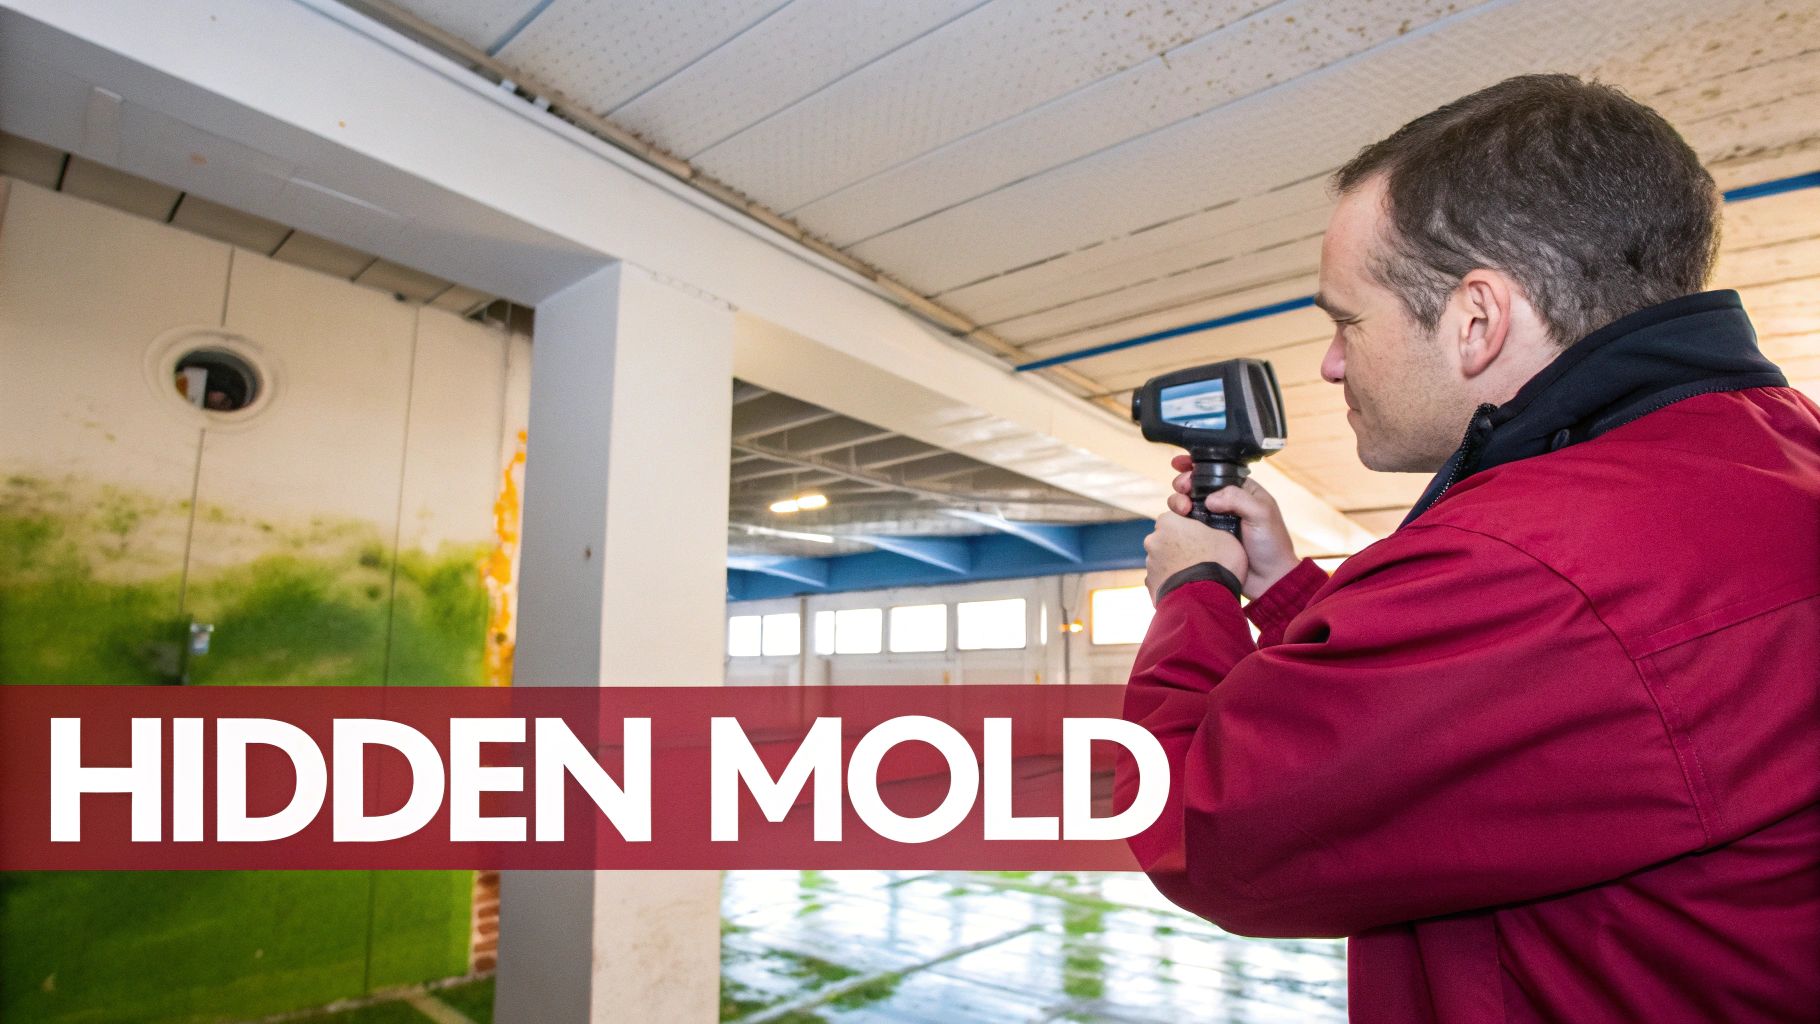
This case study details how thermal imaging was deployed as a non-destructive diagnostic tool to uncover hidden moisture and mould contamination nodes that standard visual inspections had completely missed. The core principle relies on detecting subtle temperature differences on surfaces like walls, ceilings, and ductwork. Wet or damp materials have a different thermal capacity and conductivity than dry materials, causing them to appear as distinct thermal anomalies (typically cooler spots) on a thermal camera, directly indicating areas of moisture accumulation and high mould risk.
Strategic Breakdown: The Australian Gypsum Plant Case
A leading Australian manufacturer of gypsum wallboard faced a dual crisis: inconsistent product quality and rising health concerns from staff. The suspected culprit was mould, but its source was elusive within the sprawling 15,000 m² climate-controlled facility. Specialists were brought in to conduct a comprehensive survey without halting production.
The primary objective was to systematically identify and map all locations of moisture ingress and active mould growth. The team utilised high-sensitivity thermal imaging cameras in conjunction with digital hygrometers to simultaneously capture thermal data and relative humidity readings. This dual-data approach is critical, as it allows for direct correlation between temperature anomalies and moisture levels, strengthening the diagnosis.
The survey revealed significant thermal discontinuities across walls, ceiling cavities, and HVAC components. These anomalies, appearing as cooler, well-defined areas, showed temperature variations of 2-5°C compared to surrounding dry surfaces. In these same locations, relative humidity was elevated by 8-15%, confirming them as active moisture zones. The thermal data effectively provided a "moisture map" of the entire facility, pinpointing 42 active mould contamination nodes that were previously invisible.
Analysis and Remediation
The thermal imaging data provided an irrefutable, visual roadmap of the contamination problem. By overlaying the thermal images onto the facility’s blueprints, the remediation team could plan surgical interventions, minimising operational disruption and cost. This targeted approach avoided the need for widespread, speculative demolition to find the moisture sources.
Air samples were taken from the identified high-risk zones, confirming elevated mould spore counts and identifying the specific types of fungi present, which aligned with the health symptoms reported by workers.
Key Findings and Actions:
- Contamination Mapped: The thermal survey identified 42 distinct contamination nodes linked to condensation, minor leaks, and compromised insulation.
- Targeted Remediation: A multi-faceted remediation plan was executed. This included repairing moisture ingress points, installing improved moisture barriers, and engaging certified professionals for targeted mould removal and sanitisation in the identified zones.
- System Redesign: A core part of the solution was redesigning elements of the HVAC system to improve airflow and humidity control, preventing the formation of microclimates conducive to future mould growth.
- Validation: Post-remediation air quality testing confirmed a 96% reduction in airborne mould spore counts. All worker respiratory symptoms were fully resolved within eight weeks.
This case study in using thermal imaging to detect hidden contamination nodes demonstrates its power in complex, climate-controlled environments. The project not only resolved an immediate health and safety crisis but also led to permanent improvements in the facility's environmental stability and product quality.
Actionable Takeaways and Replicable Strategy
This methodology provides a highly effective blueprint for any manufacturing facility where environmental control is critical. It moves beyond reactive problem-solving to proactive environmental management.
Practical Tips for Implementation:
- Establish a Baseline: When the facility is known to be clean and dry, conduct a full thermal survey to establish a baseline thermal profile. This makes future anomaly detection faster and more accurate.
- Correlate with Humidity Data: Always use thermal cameras in conjunction with moisture meters or hygrometers. This dual-data approach validates that thermal anomalies are caused by moisture, not other factors like structural differences.
- Time Your Scans: Conduct scans during early morning hours or periods of minimal operation. This reduces thermal "noise" from machinery and personnel, resulting in clearer images of the building's thermal envelope.
- Focus on High-Risk Zones: Prioritise scanning areas with known moisture risks, such as around plumbing, HVAC units, external walls, and areas prone to condensation.
- Verify with Lab Testing: Thermal imaging locates potential mould, but it doesn't identify it. Use air or surface sampling (e.g., NIOSH 0801 protocols) at anomaly locations to confirm the presence and type of mould.
- Integrate and Monitor: For ongoing management, integrate thermal data with your Building Management System (BMS). Regular thermal monitoring can validate the effectiveness of remediation and provide early warnings of new issues.
Integrating Thermal Diagnostics into Your Safety Strategy
As these diverse case studies demonstrate, thermal imaging is far more than a niche technology; it is a versatile and powerful diagnostic tool for modern occupational hygiene. From detecting hidden asbestos fibres in pharmaceutical HVAC systems to pinpointing pathogenic contamination risks in food processing plants, thermography provides invaluable, high-gain information that leads to more effective and efficient safety outcomes.
The key takeaway is the proactive advantage it offers. By visualising thermal anomalies, organisations can move from a reactive to a predictive stance. This shift allows them to address contamination nodes before they escalate into major health crises, production failures, or costly compliance breaches. The examples from mining, property screening, and construction further cement this principle, showing how thermal signatures can reveal everything from silica dust accumulation to hidden mould and focused meth contamination.
From Data Points to Strategic Decisions
The true power of this case study: using thermal imaging to detect hidden contamination nodes, is not just in the images produced but in the strategic intelligence they provide. A thermal camera in the right hands transforms abstract risks into tangible, visual data points that command attention and drive action.
- Visualising the Invisible: It makes unseen hazards like temperature differentials, which indicate potential contamination, immediately apparent. This is crucial for gaining buy-in from management and operational teams for necessary remediation.
- Precision Targeting: Instead of broad, disruptive, and expensive investigative work, thermal imaging allows for surgical precision. It pinpoints the exact locations of concern, saving time, resources, and minimising operational downtime.
- Enhancing Existing Protocols: Thermal diagnostics do not replace traditional methods like air sampling or surface testing. Instead, they augment them, creating a more robust and comprehensive diagnostic testing and property screening workflow. Thermography guides where to test for maximum impact.
Actionable Steps for Implementation
Embracing this technology is a strategic move towards a more resilient and safer operational environment. The journey from consideration to successful implementation involves several key steps that any organisation can follow.
- Conduct a Risk-Based Assessment: Begin by identifying the most critical contamination risks specific to your industry and facility. Are you concerned with moisture, dust accumulation, chemical residues, or biological growth? This focus will define the objectives of your thermal imaging program.
- Establish Thermal Baselines: You cannot identify an anomaly without a baseline. Work with qualified technicians to capture thermal profiles of your critical systems, equipment, and building envelopes under normal operating conditions. This reference data is the foundation of your detection strategy.
- Integrate and Train: Incorporate thermal imaging into your regular maintenance and safety inspection schedules. Ensure your team is properly trained not only on how to use the equipment but, more importantly, on how to interpret the thermographic data within the context of your specific operational risks.
- Develop a Clear Response Protocol: What happens when an anomaly is detected? A clear, documented protocol is essential. This should outline the steps for verification (e.g., follow-up air or surface sampling), reporting, and initiating corrective actions to ensure findings are addressed swiftly and effectively.
By mastering these concepts, you are not just adopting a new tool; you are embedding a culture of proactive risk management into your organisation's DNA. This case study: using thermal imaging to detect hidden contamination nodes clearly illustrates that the value lies in preventing incidents, protecting human health, ensuring product quality, and ultimately, safeguarding your bottom line. The ability to see and solve problems before they become critical failures is the ultimate competitive and safety advantage.
Ready to uncover the hidden risks in your facility? The multi-disciplinary team at Anitech specialises in integrating advanced diagnostic techniques like thermal imaging into comprehensive occupational hygiene strategies. Contact Anitech today to learn how their expertise can help you build a safer, more compliant, and more productive workplace.


